Sharm el-Sheikh Water Temperature
[better-ads type=’banner’ banner=’6711′ ]
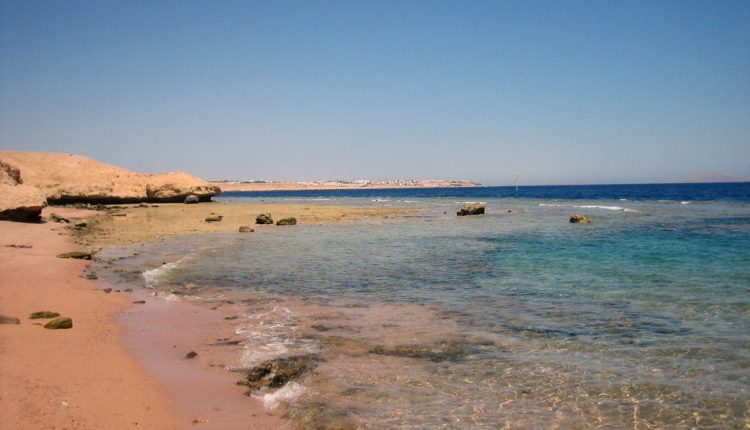
Sharm el-Sheikh is a city close to Red Sea.
August is the month with the hottest water temperature at 84°F / 28.9°C.
The coldest month is March with an ø water temperature of 72.1°F / 22.3°C.
January is the month with the lowest precipitation of 0in / 0mm and January with the highest precipitation in a year with 0in / 0mm.
The avg. air temperature is around 90.5°F / 32.5°C, August is the month with the highest temperature. January is the coolest with 61°F / 16.1°C average air temperature.
April, October, November, June, July, August, September would be the best time to visit.
hot desert climate would be the climate here.
Sharm el-Sheikh Summary
| Description | Value |
|---|---|
| Current water temperature | / |
| Warmest Month Water Temperature: | August with 28.9°C / 84°F |
| Coldest Month Water Temperature: | March with 22.3°C / 72.1°F |
| Warmest Month Air Temperature: | August with 32.5°C / 90.5°F |
| Coldest Month Air Temperature: | January with 16.1°C / 61°F |
| Wettest Month: | January with 0mm / 0in |
| Driest Month: | January with 0mm / 0in |
| Highest Humidity | January with 42.6% |
| Lowest Humidity | June with 25.5% |
| Best Time to Visit: | April, October, November, June, July, August, September |
| Climate Classification | hot desert climate |
[better-ads type=’banner’ banner=’6738′ ]
Sharm el-Sheikh water temperature by month
Red Sea water temperature by month
| Max. Water
Temperature (°C) |
ø. Water
Temperature (°C) |
Min. Water
Temperature (°C) |
|
|---|---|---|---|
|
January |
23.8 | 23.2 | 22.6 |
|
February |
22.7 | 22.5 | 22.2 |
|
March |
22.6 | 22.4 | 22.2 |
|
April |
23.7 | 23.1 | 22.5 |
|
May |
25.6 | 24.7 | 23.7 |
|
June |
27.2 | 26.1 | 25.5 |
|
July |
28.8 | 28 | 26.8 |
|
August |
29.1 | 28.9 | 28.5 |
|
September |
28.4 | 27.8 | 27.6 |
|
October |
27.9 | 27.6 | 27.1 |
|
November |
27.1 | 26.3 | 25.6 |
|
December |
25.6 | 24.6 | 23.7 |
Red Sea water temperature by month
| Max. Water
Temperature (°F) |
ø. Water
Temperature (°F) |
Min. Water
Temperature (°F) |
|
|---|---|---|---|
|
January |
74.8 | 73.8 | 72.7 |
|
February |
72.9 | 72.5 | 72 |
|
March |
72.7 | 72.3 | 72 |
|
April |
74.7 | 73.6 | 72.5 |
|
May |
78.1 | 76.5 | 74.7 |
|
June |
81 | 79 | 77.9 |
|
July |
83.8 | 82.4 | 80.2 |
|
August |
84.4 | 84 | 83.3 |
|
September |
83.1 | 82 | 81.7 |
|
October |
82.2 | 81.7 | 80.8 |
|
November |
80.8 | 79.3 | 78.1 |
|
December |
78.1 | 76.3 | 74.7 |
August is the month with the warmest water temperature at 84°F / 28.9°C.
The month with the coldest is March with an average water temperature of 72.1°F / 22.3°C.
[better-ads type=’banner’ banner=’7369′ ]
Sharm el-Sheikh weather today & 14-day weather forecast
|
|
|
|
|
|
|
Rel. Humidity |
|---|---|---|---|---|---|---|
|
|
Clear Sky
|
|
|
|
|
|
|
|
Few clouds
|
|
|
|
|
|
|
|
Clear Sky
|
|
|
|
|
|
|
|
Clear Sky
|
|
|
|
|
|
|
|
Few clouds
|
|
|
|
|
|
|
|
Few clouds
|
|
|
|
|
|
|
|
Few clouds
|
|
|
|
|
|
|
|
|
|
|
|
|
Rel. Humidity |
|---|---|---|---|---|---|---|
|
|
Few clouds
|
|
|
|
|
|
|
|
Few clouds
|
|
|
|
|
|
|
|
Few clouds
|
|
|
|
|
|
|
|
Few clouds
|
|
|
|
|
|
|
|
Clear Sky
|
|
|
|
|
|
|
|
Clear Sky
|
|
|
|
|
|
|
|
Clear Sky
|
|
|
|
|
|
|
|
Clear Sky
|
|
|
|
|
|
|
|
Clear Sky
|
|
|
|
|
|
Sharm el-Sheikh weather by month / climate table
Max. Temperature °C | ø. Temperature °C | Min. Temperature (°C) |
Precip. (mm) |
Rainy Days (d) |
Rel. Humidity (%) |
|
|---|---|---|---|---|---|---|
|
January |
22 | 16.1 | 9.7 | 0 | 0 | 42.6% |
|
February |
24.3 | 17.7 | 10 | 0 | 0 | 37.5% |
|
March |
27.4 | 20.8 | 12.9 | 0 | 0 | 32.6% |
|
April |
32.5 | 24.5 | 15.6 | 0 | 0 | 28.1% |
|
May |
36.3 | 28.5 | 19 | 0 | 0 | 26% |
|
June |
37.4 | 31.3 | 22.9 | 0 | 0 | 25.5% |
|
July |
38.4 | 32.2 | 24.1 | 0 | 0 | 28.5% |
|
August |
38.9 | 32.5 | 24.5 | 0 | 0 | 30.2% |
|
September |
37.2 | 30.6 | 22.6 | 0 | 0 | 33.2% |
|
October |
34.9 | 27 | 17.7 | 0 | 0 | 38.1% |
|
November |
28.8 | 22 | 14 | 0 | 0 | 41% |
|
December |
24.7 | 17.6 | 10.8 | 0 | 0 | 42.2% |
Max. Temperature °F | ø. Temperature °F | Min. Temperature (°F) |
Precip. (in) |
Rainy Days (d) |
Rel. Humidity (%) |
|
|---|---|---|---|---|---|---|
|
January |
71.6 | 61 | 49.5 | 0 | 0 | 42.6% |
|
February |
75.7 | 63.9 | 50 | 0 | 0 | 37.5% |
|
March |
81.3 | 69.4 | 55.2 | 0 | 0 | 32.6% |
|
April |
90.5 | 76.1 | 60.1 | 0 | 0 | 28.1% |
|
May |
97.3 | 83.3 | 66.2 | 0 | 0 | 26% |
|
June |
99.3 | 88.3 | 73.2 | 0 | 0 | 25.5% |
|
July |
101.1 | 90 | 75.4 | 0 | 0 | 28.5% |
|
August |
102 | 90.5 | 76.1 | 0 | 0 | 30.2% |
|
September |
99 | 87.1 | 72.7 | 0 | 0 | 33.2% |
|
October |
94.8 | 80.6 | 63.9 | 0 | 0 | 38.1% |
|
November |
83.8 | 71.6 | 57.2 | 0 | 0 | 41% |
|
December |
76.5 | 63.7 | 51.4 | 0 | 0 | 42.2% |
The warmest avg. temperature is around 90.5°F / 32.5°C, August is the month with the highest temperature. January is the coolest with 61°F / 16.1°C average air temperature.
January is the month with the min. precipitation of 0in / 0mm and January with the max. precipitation in a year with 0in / 0mm.
Activities & POI in Sharm el-Sheikh
| Type of Activity | List |
|---|---|
| Beach | Wind Beach, Coral beach, Active Beach, Relax Beach |
| Marina for Sailing, Boat adventures, fishing | Travco |
| Attraction | Casino Sharm, Sinai Grand Casino, Mangrove trees, Остров с белым песком, Alf Leila Wa Leila, Night Disco "Antalia" |