Boca del Río Water Temperature
[better-ads type=’banner’ banner=’6711′ ]
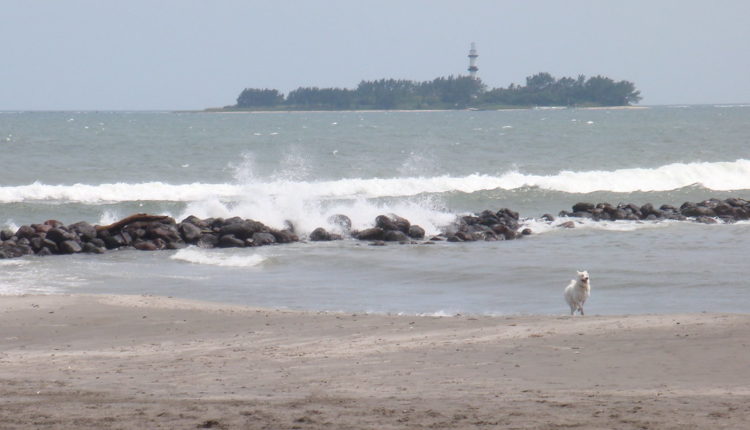
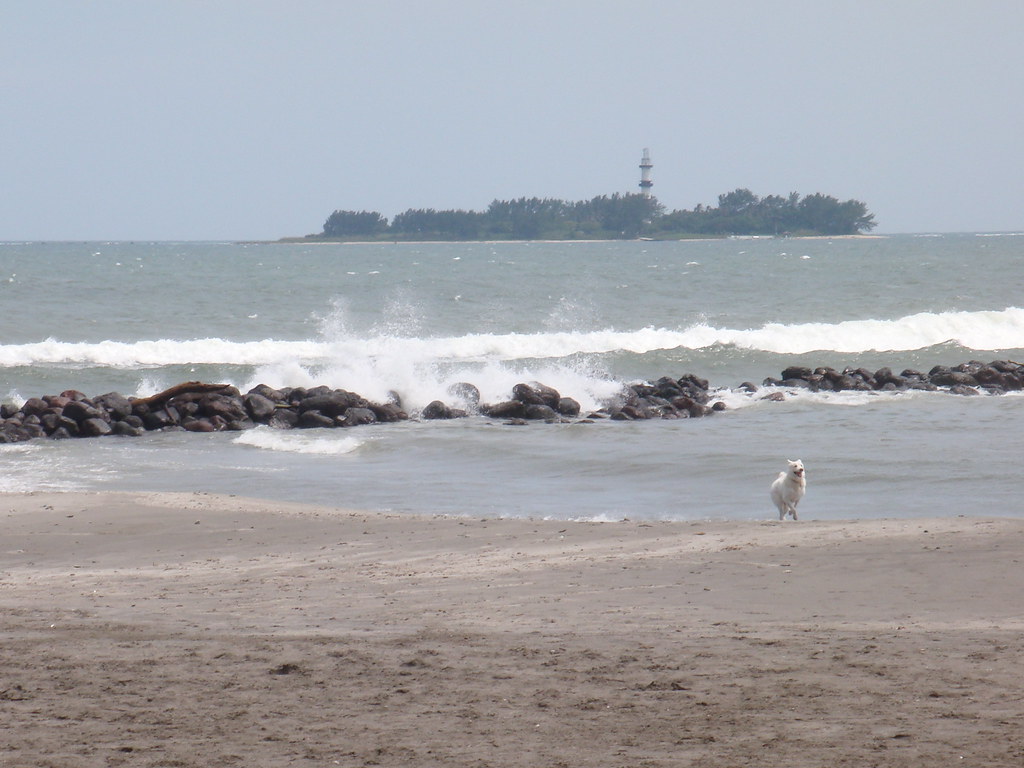
Boca del Río is a town close to Bay of Campeche.
September is the month with the highest water temperature at 85.3°F / 29.6°C.
The coldest month is February with an average water temperature of 73.8°F / 23.2°C.
March is the driest at 0in / 0mm and September the wettest month with 14.5in / 369.1mm.
With an average air temperature of 82°F / 27.8°C, May is the warmest month in a year. January is the coldest with 70.3°F / 21.3°C average air temperature.
The Climate is described as tropical savanna climate with wet summer. Best time to Visit would be in February, March, April, May, October, November, December.
Boca del Río Summary
| Description | Value |
|---|---|
| Current water temperature | / |
| Warmest Month Water Temperature: | September with 29.6°C / 85.3°F |
| Coldest Month Water Temperature: | February with 23.2°C / 73.8°F |
| Warmest Month Air Temperature: | May with 27.8°C / 82°F |
| Coldest Month Air Temperature: | January with 21.3°C / 70.3°F |
| Wettest Month: | September with 369.1mm / 14.5in |
| Driest Month: | March with 0mm / 0in |
| Highest Humidity | September with 83.2% |
| Lowest Humidity | April with 71.2% |
| Best Time to Visit: | February, March, April, May, October, November, December |
| Climate Classification | tropical savanna climate with wet summer |
[better-ads type=’banner’ banner=’6738′ ]
Boca del Río water temperature by month
Bay of Campeche water temperature by month
| Max. Water
Temperature (°C) |
ø. Water
Temperature (°C) |
Min. Water
Temperature (°C) |
|
|---|---|---|---|
|
January |
24 | 23.4 | 23 |
|
February |
23.8 | 23.3 | 22.9 |
|
March |
25.1 | 24.2 | 23.7 |
|
April |
26.7 | 25.8 | 25 |
|
May |
28.2 | 27.4 | 26.7 |
|
June |
28.7 | 28.4 | 28.1 |
|
July |
29.4 | 28.9 | 28.7 |
|
August |
29.6 | 29.5 | 29.4 |
|
September |
29.8 | 29.5 | 29 |
|
October |
29 | 28.5 | 27.6 |
|
November |
27.7 | 26.6 | 25.5 |
|
December |
25.5 | 24.8 | 24 |
Bay of Campeche water temperature by month
| Max. Water
Temperature (°F) |
ø. Water
Temperature (°F) |
Min. Water
Temperature (°F) |
|
|---|---|---|---|
|
January |
75.2 | 74.1 | 73.4 |
|
February |
74.8 | 73.9 | 73.2 |
|
March |
77.2 | 75.6 | 74.7 |
|
April |
80.1 | 78.4 | 77 |
|
May |
82.8 | 81.3 | 80.1 |
|
June |
83.7 | 83.1 | 82.6 |
|
July |
84.9 | 84 | 83.7 |
|
August |
85.3 | 85.1 | 84.9 |
|
September |
85.6 | 85.1 | 84.2 |
|
October |
84.2 | 83.3 | 81.7 |
|
November |
81.9 | 79.9 | 77.9 |
|
December |
77.9 | 76.6 | 75.2 |
The hottest water temperature typically reached in September with around 85.3°F / 29.6°C.
The coldest in February with an average water temperature of 73.8°F / 23.2°C.
[better-ads type=’banner’ banner=’7369′ ]
Boca del Río weather today & 14-day weather forecast
|
|
|
|
|
|
|
Rel. Humidity |
|---|---|---|---|---|---|---|
|
|
Few clouds
|
|
|
|
|
|
|
|
Clear Sky
|
|
|
|
|
|
|
|
Clear Sky
|
|
|
|
|
|
|
|
Clear Sky
|
|
|
|
|
|
|
|
Thunderstorm with rain
|
|
|
|
|
|
|
|
Heavy rain
|
|
|
|
|
|
|
|
Moderate rain
|
|
|
|
|
|
|
|
|
|
|
|
|
Rel. Humidity |
|---|---|---|---|---|---|---|
|
|
Few clouds
|
|
|
|
|
|
|
|
Few clouds
|
|
|
|
|
|
|
|
Few clouds
|
|
|
|
|
|
|
|
Few clouds
|
|
|
|
|
|
|
|
Thunderstorm with heavy rain
|
|
|
|
|
|
|
|
Thunderstorm with rain
|
|
|
|
|
|
|
|
Thunderstorm with rain
|
|
|
|
|
|
|
|
Thunderstorm with rain
|
|
|
|
|
|
|
|
Thunderstorm with rain
|
|
|
|
|
|
Boca del Río weather by month / climate table
Max. Temperature °C | ø. Temperature °C | Min. Temperature (°C) |
Precip. (mm) |
Rainy Days (d) |
Rel. Humidity (%) |
|
|---|---|---|---|---|---|---|
|
January |
25.7 | 21.3 | 17.7 | 11.2 | 0 | 75.2% |
|
February |
28.2 | 22.3 | 18.5 | 8.9 | 0 | 75.9% |
|
March |
30.1 | 24.1 | 19.8 | 0 | 0 | 72.6% |
|
April |
32.3 | 26.4 | 22.1 | 0 | 0 | 71.2% |
|
May |
32.7 | 27.8 | 24.2 | 15.7 | 2 | 72.5% |
|
June |
31.6 | 27.3 | 23.9 | 220.1 | 23 | 79.6% |
|
July |
30.6 | 26.8 | 23.6 | 300.7 | 23 | 82.2% |
|
August |
30.8 | 27 | 24 | 283.4 | 24 | 81.6% |
|
September |
30.1 | 26.5 | 23.8 | 369.1 | 25 | 83.2% |
|
October |
29.2 | 25.5 | 22.1 | 178.2 | 0 | 79.6% |
|
November |
27.5 | 23.4 | 19.8 | 35 | 2 | 76.2% |
|
December |
26.4 | 22.2 | 18.4 | 8 | 0 | 76.3% |
Max. Temperature °F | ø. Temperature °F | Min. Temperature (°F) |
Precip. (in) |
Rainy Days (d) |
Rel. Humidity (%) |
|
|---|---|---|---|---|---|---|
|
January |
78.3 | 70.3 | 63.9 | 0.4 | 0 | 75.2% |
|
February |
82.8 | 72.1 | 65.3 | 0.4 | 0 | 75.9% |
|
March |
86.2 | 75.4 | 67.6 | 0 | 0 | 72.6% |
|
April |
90.1 | 79.5 | 71.8 | 0 | 0 | 71.2% |
|
May |
90.9 | 82 | 75.6 | 0.6 | 2 | 72.5% |
|
June |
88.9 | 81.1 | 75 | 8.7 | 23 | 79.6% |
|
July |
87.1 | 80.2 | 74.5 | 11.8 | 23 | 82.2% |
|
August |
87.4 | 80.6 | 75.2 | 11.2 | 24 | 81.6% |
|
September |
86.2 | 79.7 | 74.8 | 14.5 | 25 | 83.2% |
|
October |
84.6 | 77.9 | 71.8 | 7 | 0 | 79.6% |
|
November |
81.5 | 74.1 | 67.6 | 1.4 | 2 | 76.2% |
|
December |
79.5 | 72 | 65.1 | 0.3 | 0 | 76.3% |
March is the driest at 0in / 0mm and September the wettest month with 14.5in / 369.1mm.
With an average temperature of 82°F / 27.8°C, May is the warmest month in a year. January is the coldest with 70.3°F / 21.3°C average temperature.
Activities & POI in Boca del Río
| Type of Activity | List |
|---|---|
| Beach | Playa Vicente Fox, Playa Mocambo |
| Marina for Sailing, Boat adventures, fishing | Marina |