Golfe-Juan Water Temperature
[better-ads type=’banner’ banner=’6711′ ]
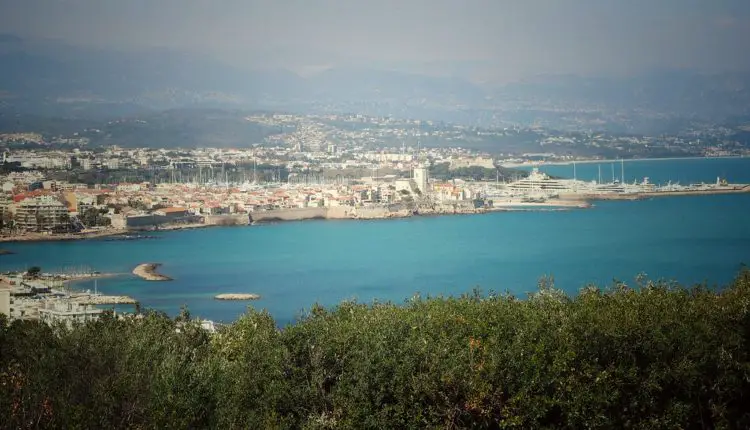
Golfe-Juan is a village close to Mediterranean Sea.
August is the month with the highest water temperature at 76.3°F / 24.6°C.
The coldest month is February with an average water temperature of 55.6°F / 13.1°C.
October is the driest at 0in / 0mm and April the wettest month with 1.1in / 27.1mm.
With an average air temperature of 74.7°F / 23.7°C, August is the warmest month in a year. February is the coldest with 45.3°F / 7.4°C average air temperature.
The Climate is described as temperate climate with warm and dry summer. Best time to Visit would be in July, August, June, September.
Golfe-Juan Summary
| Description | Value |
|---|---|
| Current water temperature | / |
| Warmest Month Water Temperature: | August with 24.6°C / 76.3°F |
| Coldest Month Water Temperature: | February with 13.1°C / 55.6°F |
| Warmest Month Air Temperature: | August with 23.7°C / 74.7°F |
| Coldest Month Air Temperature: | February with 7.4°C / 45.3°F |
| Wettest Month: | April with 27.1mm / 1.1in |
| Driest Month: | October with 0mm / 0in |
| Highest Humidity | October with 76.7% |
| Lowest Humidity | July with 69.6% |
| Best Time to Visit: | July, August, June, September |
| Climate Classification | temperate climate with warm and dry summer |
[better-ads type=’banner’ banner=’6738′ ]
Golfe-Juan water temperature by month
Mediterranean Sea water temperature by month
| Max. Water
Temperature (°C) |
ø. Water
Temperature (°C) |
Min. Water
Temperature (°C) |
|
|---|---|---|---|
|
January |
14.4 | 13.8 | 13.3 |
|
February |
13.4 | 13.2 | 13 |
|
March |
13.6 | 13.3 | 13 |
|
April |
15.7 | 14.4 | 13.5 |
|
May |
19.2 | 17.3 | 15.7 |
|
June |
23.4 | 21.2 | 19.1 |
|
July |
24.6 | 23.8 | 23.1 |
|
August |
24.9 | 24.5 | 24 |
|
September |
24 | 22.7 | 21.7 |
|
October |
21.7 | 20.2 | 19 |
|
November |
18.9 | 17.6 | 16.4 |
|
December |
16.4 | 15.5 | 14.5 |
Mediterranean Sea water temperature by month
| Max. Water
Temperature (°F) |
ø. Water
Temperature (°F) |
Min. Water
Temperature (°F) |
|
|---|---|---|---|
|
January |
57.9 | 56.8 | 55.9 |
|
February |
56.1 | 55.8 | 55.4 |
|
March |
56.5 | 55.9 | 55.4 |
|
April |
60.3 | 57.9 | 56.3 |
|
May |
66.6 | 63.1 | 60.3 |
|
June |
74.1 | 70.2 | 66.4 |
|
July |
76.3 | 74.8 | 73.6 |
|
August |
76.8 | 76.1 | 75.2 |
|
September |
75.2 | 72.9 | 71.1 |
|
October |
71.1 | 68.4 | 66.2 |
|
November |
66 | 63.7 | 61.5 |
|
December |
61.5 | 59.9 | 58.1 |
The warmest water temperature are in August with around 76.3°F / 24.6°C.
The coldest in February with an average water temperature of 55.6°F / 13.1°C.
[better-ads type=’banner’ banner=’7369′ ]
Golfe-Juan weather today & 14-day weather forecast
|
|
|
|
|
|
|
Rel. Humidity |
|---|---|---|---|---|---|---|
|
|
Few clouds
|
|
|
|
|
|
|
|
Scattered clouds
|
|
|
|
|
|
|
|
Broken clouds
|
|
|
|
|
|
|
|
Broken clouds
|
|
|
|
|
|
|
|
Broken clouds
|
|
|
|
|
|
|
|
Broken clouds
|
|
|
|
|
|
|
|
Overcast clouds
|
|
|
|
|
|
|
|
|
|
|
|
|
Rel. Humidity |
|---|---|---|---|---|---|---|
|
|
Overcast clouds
|
|
|
|
|
|
|
|
Broken clouds
|
|
|
|
|
|
|
|
Broken clouds
|
|
|
|
|
|
|
|
Broken clouds
|
|
|
|
|
|
|
|
Clear Sky
|
|
|
|
|
|
|
|
Few clouds
|
|
|
|
|
|
|
|
Few clouds
|
|
|
|
|
|
|
|
Few clouds
|
|
|
|
|
|
|
|
Clear Sky
|
|
|
|
|
|
Golfe-Juan weather by month / climate table
Max. Temperature °C | ø. Temperature °C | Min. Temperature (°C) |
Precip. (mm) |
Rainy Days (d) |
Rel. Humidity (%) |
|
|---|---|---|---|---|---|---|
|
January |
11.6 | 7.5 | 3 | 12.4 | 0 | 75.2% |
|
February |
11.8 | 7.4 | 2.2 | 8 | 0 | 73.2% |
|
March |
15.7 | 10 | 3.8 | 8.1 | 0 | 71.4% |
|
April |
18.7 | 12.9 | 7.3 | 27.1 | 1 | 72.9% |
|
May |
22.3 | 16.8 | 10.5 | 26.4 | 1 | 73.5% |
|
June |
26.4 | 21 | 14.9 | 3 | 0 | 73.5% |
|
July |
28 | 23.7 | 18.9 | 3.6 | 0 | 69.6% |
|
August |
28 | 23.7 | 19.3 | 1.1 | 0 | 70.7% |
|
September |
26 | 20.4 | 14.7 | 2.5 | 0 | 71.8% |
|
October |
21.7 | 16.5 | 11.8 | 0 | 0 | 76.7% |
|
November |
17.5 | 11.9 | 6.7 | 21.5 | 1 | 76.6% |
|
December |
13.2 | 8.6 | 3.6 | 9.5 | 0 | 75.3% |
Max. Temperature °F | ø. Temperature °F | Min. Temperature (°F) |
Precip. (in) |
Rainy Days (d) |
Rel. Humidity (%) |
|
|---|---|---|---|---|---|---|
|
January |
52.9 | 45.5 | 37.4 | 0.5 | 0 | 75.2% |
|
February |
53.2 | 45.3 | 36 | 0.3 | 0 | 73.2% |
|
March |
60.3 | 50 | 38.8 | 0.3 | 0 | 71.4% |
|
April |
65.7 | 55.2 | 45.1 | 1.1 | 1 | 72.9% |
|
May |
72.1 | 62.2 | 50.9 | 1 | 1 | 73.5% |
|
June |
79.5 | 69.8 | 58.8 | 0.1 | 0 | 73.5% |
|
July |
82.4 | 74.7 | 66 | 0.1 | 0 | 69.6% |
|
August |
82.4 | 74.7 | 66.7 | 0 | 0 | 70.7% |
|
September |
78.8 | 68.7 | 58.5 | 0.1 | 0 | 71.8% |
|
October |
71.1 | 61.7 | 53.2 | 0 | 0 | 76.7% |
|
November |
63.5 | 53.4 | 44.1 | 0.8 | 1 | 76.6% |
|
December |
55.8 | 47.5 | 38.5 | 0.4 | 0 | 75.3% |
October is the most draught at 0in / 0mm and April the month with the most rain around 1.1in / 27.1mm.
The avg. temperature is around 74.7°F / 23.7°C, August is the hottest month in a year. February is the coolest with 45.3°F / 7.4°C avg. temperature.
Activities & POI in Golfe-Juan
| Type of Activity | List |
|---|---|
| Beach | Plage de la Batterie, Plages du Soleil, Plages du Midi, Plage publique de la Mirandole |
| Marina for Sailing, Boat adventures, fishing | Port Camille Rayon, Vieux port |