La Paloma Water Temperature
[better-ads type=’banner’ banner=’6711′ ]
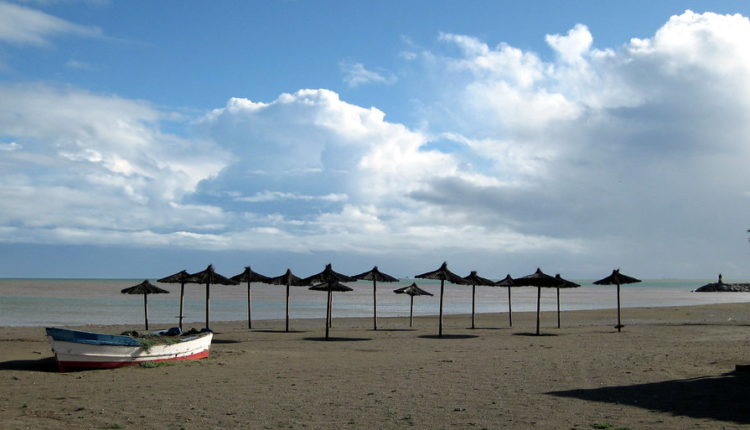
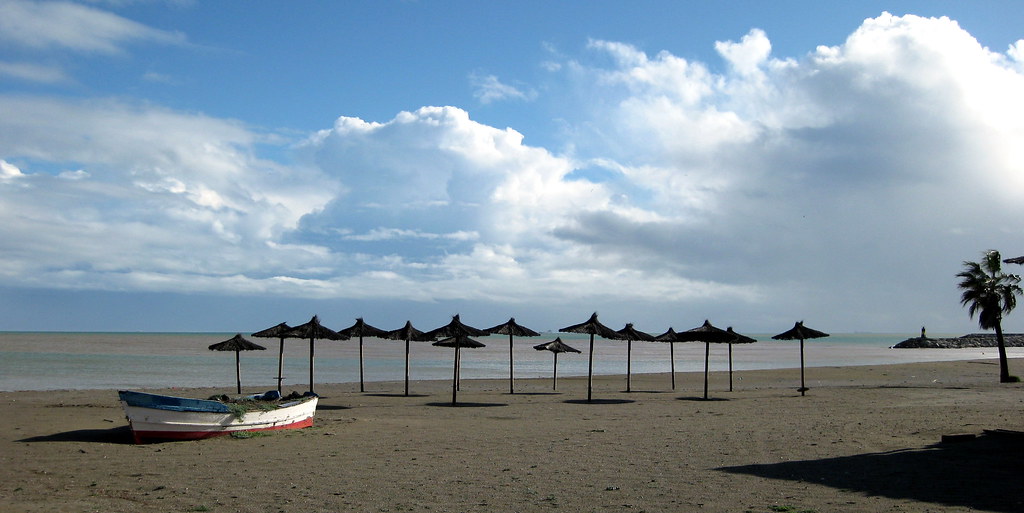
La Paloma is a village close to Alboran Sea.
August is the month with the highest water temperature at 69.6°F / 20.9°C.
The coldest month is February with an average water temperature of 58.5°F / 14.7°C.
January is the driest at 0in / 0mm and November the wettest month with 0.4in / 9.2mm.
With an average air temperature of 76.8°F / 24.9°C, August is the warmest month in a year. January is the coldest with 50.5°F / 10.3°C average air temperature.
The Climate is described as temperate climate with dry and hot summer. Best time to Visit would be in June, July, August, September.
La Paloma Summary
| Description | Value |
|---|---|
| Current water temperature | / |
| Warmest Month Water Temperature: | August with 20.9°C / 69.6°F |
| Coldest Month Water Temperature: | February with 14.7°C / 58.5°F |
| Warmest Month Air Temperature: | August with 24.9°C / 76.8°F |
| Coldest Month Air Temperature: | January with 10.3°C / 50.5°F |
| Wettest Month: | November with 9.2mm / 0.4in |
| Driest Month: | January with 0mm / 0in |
| Highest Humidity | December with 79.1% |
| Lowest Humidity | July with 53.1% |
| Best Time to Visit: | June, July, August, September |
| Climate Classification | temperate climate with dry and hot summer |
[better-ads type=’banner’ banner=’6738′ ]
La Paloma water temperature by month
Alboran Sea water temperature by month
| Max. Water
Temperature (°C) |
ø. Water
Temperature (°C) |
Min. Water
Temperature (°C) |
|
|---|---|---|---|
|
January |
15.8 | 15.3 | 14.9 |
|
February |
15 | 14.7 | 14.6 |
|
March |
15.3 | 14.9 | 14.6 |
|
April |
16.1 | 15.5 | 15.2 |
|
May |
17.4 | 16.6 | 15.9 |
|
June |
19.3 | 18.3 | 17.5 |
|
July |
20.8 | 20 | 19.2 |
|
August |
21.1 | 20.8 | 20.5 |
|
September |
21.2 | 20.4 | 19.7 |
|
October |
19.8 | 19 | 18.1 |
|
November |
18.1 | 17.1 | 16.3 |
|
December |
16.4 | 16 | 15.6 |
Alboran Sea water temperature by month
| Max. Water
Temperature (°F) |
ø. Water
Temperature (°F) |
Min. Water
Temperature (°F) |
|
|---|---|---|---|
|
January |
60.4 | 59.5 | 58.8 |
|
February |
59 | 58.5 | 58.3 |
|
March |
59.5 | 58.8 | 58.3 |
|
April |
61 | 59.9 | 59.4 |
|
May |
63.3 | 61.9 | 60.6 |
|
June |
66.7 | 64.9 | 63.5 |
|
July |
69.4 | 68 | 66.6 |
|
August |
70 | 69.4 | 68.9 |
|
September |
70.2 | 68.7 | 67.5 |
|
October |
67.6 | 66.2 | 64.6 |
|
November |
64.6 | 62.8 | 61.3 |
|
December |
61.5 | 60.8 | 60.1 |
The highest water temperature will be reached in August with around 69.6°F / 20.9°C.
The lowest in February with an average water temperature of 58.5°F / 14.7°C.
[better-ads type=’banner’ banner=’7369′ ]
La Paloma weather today & 14-day weather forecast
|
|
|
|
|
|
|
Rel. Humidity |
|---|---|---|---|---|---|---|
|
|
Few clouds
|
|
|
|
|
|
|
|
Scattered clouds
|
|
|
|
|
|
|
|
Clear Sky
|
|
|
|
|
|
|
|
Clear Sky
|
|
|
|
|
|
|
|
Clear Sky
|
|
|
|
|
|
|
|
Clear Sky
|
|
|
|
|
|
|
|
Clear Sky
|
|
|
|
|
|
|
|
|
|
|
|
|
Rel. Humidity |
|---|---|---|---|---|---|---|
|
|
Few clouds
|
|
|
|
|
|
|
|
Clear Sky
|
|
|
|
|
|
|
|
Clear Sky
|
|
|
|
|
|
|
|
Clear Sky
|
|
|
|
|
|
|
|
Clear Sky
|
|
|
|
|
|
|
|
Clear Sky
|
|
|
|
|
|
|
|
Clear Sky
|
|
|
|
|
|
|
|
Clear Sky
|
|
|
|
|
|
|
|
Clear Sky
|
|
|
|
|
|
La Paloma weather by month / climate table
Max. Temperature °C | ø. Temperature °C | Min. Temperature (°C) |
Precip. (mm) |
Rainy Days (d) |
Rel. Humidity (%) |
|
|---|---|---|---|---|---|---|
|
January |
14.8 | 10.3 | 6.5 | 0 | 0 | 77.3% |
|
February |
15 | 10.5 | 6.3 | 4.4 | 0 | 74.7% |
|
March |
17.3 | 12.4 | 7.8 | 0 | 0 | 72.4% |
|
April |
20 | 14.2 | 9.3 | 0 | 0 | 70.6% |
|
May |
23.7 | 17.4 | 11.1 | 0 | 0 | 64.5% |
|
June |
28.4 | 21.6 | 15.8 | 0 | 0 | 57.6% |
|
July |
30.7 | 24.7 | 19.2 | 0 | 0 | 53.1% |
|
August |
30.3 | 24.9 | 20.1 | 0 | 0 | 56.2% |
|
September |
27.6 | 21.7 | 16.9 | 0 | 0 | 66.5% |
|
October |
24 | 18.1 | 13.2 | 0 | 0 | 74.2% |
|
November |
18.9 | 13.4 | 8.6 | 9.2 | 0 | 76.4% |
|
December |
15.4 | 11.3 | 7.6 | 0 | 0 | 79.1% |
Max. Temperature °F | ø. Temperature °F | Min. Temperature (°F) |
Precip. (in) |
Rainy Days (d) |
Rel. Humidity (%) |
|
|---|---|---|---|---|---|---|
|
January |
58.6 | 50.5 | 43.7 | 0 | 0 | 77.3% |
|
February |
59 | 50.9 | 43.3 | 0.2 | 0 | 74.7% |
|
March |
63.1 | 54.3 | 46 | 0 | 0 | 72.4% |
|
April |
68 | 57.6 | 48.7 | 0 | 0 | 70.6% |
|
May |
74.7 | 63.3 | 52 | 0 | 0 | 64.5% |
|
June |
83.1 | 70.9 | 60.4 | 0 | 0 | 57.6% |
|
July |
87.3 | 76.5 | 66.6 | 0 | 0 | 53.1% |
|
August |
86.5 | 76.8 | 68.2 | 0 | 0 | 56.2% |
|
September |
81.7 | 71.1 | 62.4 | 0 | 0 | 66.5% |
|
October |
75.2 | 64.6 | 55.8 | 0 | 0 | 74.2% |
|
November |
66 | 56.1 | 47.5 | 0.4 | 0 | 76.4% |
|
December |
59.7 | 52.3 | 45.7 | 0 | 0 | 79.1% |
January is the month with the lowest rain of 0in / 0mm and November with the highest precipitation in a year with 0.4in / 9.2mm.
The avg. temperature is around 76.8°F / 24.9°C, August is the month with the highest temperature. January is the coolest with 50.5°F / 10.3°C average temperature.