Cala en Porter Water Temperature
[better-ads type=’banner’ banner=’6711′ ]
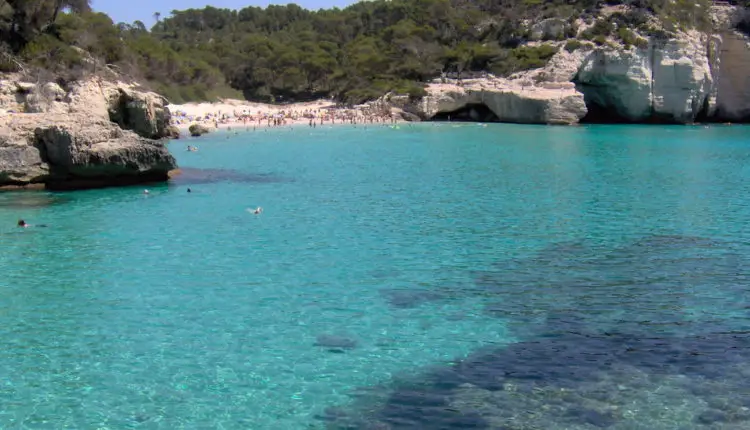
Cala en Porter is a town close to Balearic Sea.
August is the month with the highest water temperature at 79.5°F / 26.4°C.
The coldest month is February with an average water temperature of 56.8°F / 13.8°C.
March is the driest at 0in / 0mm and November the wettest month with 1.4in / 35mm.
With an average air temperature of 77.2°F / 25.1°C, August is the warmest month in a year. February is the coldest with 52.5°F / 11.4°C average air temperature.
The Climate is described as temperate climate with dry and hot summer. Best time to Visit would be in June, July, August, September.
Cala en Porter Summary
| Description | Value |
|---|---|
| Current water temperature | / |
| Warmest Month Water Temperature: | August with 26.4°C / 79.5°F |
| Coldest Month Water Temperature: | February with 13.8°C / 56.8°F |
| Warmest Month Air Temperature: | August with 25.1°C / 77.2°F |
| Coldest Month Air Temperature: | February with 11.4°C / 52.5°F |
| Wettest Month: | November with 35mm / 1.4in |
| Driest Month: | March with 0mm / 0in |
| Highest Humidity | April with 76.9% |
| Lowest Humidity | September with 69.8% |
| Best Time to Visit: | June, July, August, September |
| Climate Classification | temperate climate with dry and hot summer |
[better-ads type=’banner’ banner=’6738′ ]
Cala en Porter water temperature by month
Balearic Sea water temperature by month
| Max. Water
Temperature (°C) |
ø. Water
Temperature (°C) |
Min. Water
Temperature (°C) |
|
|---|---|---|---|
|
January |
15.5 | 14.8 | 14.2 |
|
February |
14.2 | 13.9 | 13.7 |
|
March |
14.5 | 14 | 13.7 |
|
April |
16.5 | 15.3 | 14.5 |
|
May |
20 | 17.9 | 16.4 |
|
June |
24 | 21.8 | 19.9 |
|
July |
26.1 | 25.1 | 24 |
|
August |
26.5 | 26.3 | 26 |
|
September |
26.1 | 25.3 | 24.2 |
|
October |
24.2 | 22.8 | 21.3 |
|
November |
21.3 | 19.4 | 17.8 |
|
December |
17.8 | 16.6 | 15.5 |
Balearic Sea water temperature by month
| Max. Water
Temperature (°F) |
ø. Water
Temperature (°F) |
Min. Water
Temperature (°F) |
|
|---|---|---|---|
|
January |
59.9 | 58.6 | 57.6 |
|
February |
57.6 | 57 | 56.7 |
|
March |
58.1 | 57.2 | 56.7 |
|
April |
61.7 | 59.5 | 58.1 |
|
May |
68 | 64.2 | 61.5 |
|
June |
75.2 | 71.2 | 67.8 |
|
July |
79 | 77.2 | 75.2 |
|
August |
79.7 | 79.3 | 78.8 |
|
September |
79 | 77.5 | 75.6 |
|
October |
75.6 | 73 | 70.3 |
|
November |
70.3 | 66.9 | 64 |
|
December |
64 | 61.9 | 59.9 |
August is the month with the warmest water temperature at 79.5°F / 26.4°C.
The month with the coldest is February with an average water temperature of 56.8°F / 13.8°C.
[better-ads type=’banner’ banner=’7369′ ]
Cala en Porter weather today & 14-day weather forecast
|
|
|
|
|
|
|
Rel. Humidity |
|---|---|---|---|---|---|---|
|
|
Few clouds
|
|
|
|
|
|
|
|
Scattered clouds
|
|
|
|
|
|
|
|
Scattered clouds
|
|
|
|
|
|
|
|
Few clouds
|
|
|
|
|
|
|
|
Few clouds
|
|
|
|
|
|
|
|
Few clouds
|
|
|
|
|
|
|
|
Scattered clouds
|
|
|
|
|
|
|
|
|
|
|
|
|
Rel. Humidity |
|---|---|---|---|---|---|---|
|
|
Few clouds
|
|
|
|
|
|
|
|
Few clouds
|
|
|
|
|
|
|
|
Few clouds
|
|
|
|
|
|
|
|
Few clouds
|
|
|
|
|
|
|
|
Clear Sky
|
|
|
|
|
|
|
|
Few clouds
|
|
|
|
|
|
|
|
Few clouds
|
|
|
|
|
|
|
|
Clear Sky
|
|
|
|
|
|
|
|
Clear Sky
|
|
|
|
|
|
Cala en Porter weather by month / climate table
Max. Temperature °C | ø. Temperature °C | Min. Temperature (°C) |
Precip. (mm) |
Rainy Days (d) |
Rel. Humidity (%) |
|
|---|---|---|---|---|---|---|
|
January |
14.2 | 12.2 | 9.3 | 5.3 | 0 | 72.8% |
|
February |
13.2 | 11.4 | 9.2 | 5.5 | 0 | 71.3% |
|
March |
15.1 | 12.8 | 10.4 | 0 | 0 | 74.7% |
|
April |
17.5 | 14.8 | 12.2 | 0 | 0 | 76.9% |
|
May |
21 | 17.5 | 14.5 | 0 | 0 | 76.8% |
|
June |
25.1 | 21.4 | 18 | 0 | 0 | 75.3% |
|
July |
26.8 | 24.4 | 22.1 | 0 | 0 | 72.3% |
|
August |
26.9 | 25.1 | 23.1 | 0 | 0 | 71% |
|
September |
25.5 | 23.1 | 20.1 | 0 | 0 | 69.8% |
|
October |
23.1 | 20.3 | 17.1 | 3.3 | 0 | 73% |
|
November |
19.8 | 16.1 | 13 | 35 | 1 | 71.2% |
|
December |
15.7 | 13.5 | 11.2 | 8.3 | 1 | 72.1% |
Max. Temperature °F | ø. Temperature °F | Min. Temperature (°F) |
Precip. (in) |
Rainy Days (d) |
Rel. Humidity (%) |
|
|---|---|---|---|---|---|---|
|
January |
57.6 | 54 | 48.7 | 0.2 | 0 | 72.8% |
|
February |
55.8 | 52.5 | 48.6 | 0.2 | 0 | 71.3% |
|
March |
59.2 | 55 | 50.7 | 0 | 0 | 74.7% |
|
April |
63.5 | 58.6 | 54 | 0 | 0 | 76.9% |
|
May |
69.8 | 63.5 | 58.1 | 0 | 0 | 76.8% |
|
June |
77.2 | 70.5 | 64.4 | 0 | 0 | 75.3% |
|
July |
80.2 | 75.9 | 71.8 | 0 | 0 | 72.3% |
|
August |
80.4 | 77.2 | 73.6 | 0 | 0 | 71% |
|
September |
77.9 | 73.6 | 68.2 | 0 | 0 | 69.8% |
|
October |
73.6 | 68.5 | 62.8 | 0.1 | 0 | 73% |
|
November |
67.6 | 61 | 55.4 | 1.4 | 1 | 71.2% |
|
December |
60.3 | 56.3 | 52.2 | 0.3 | 1 | 72.1% |
March is the driest at 0in / 0mm and November the wettest month with 1.4in / 35mm.
With an average temperature of 77.2°F / 25.1°C, August is the warmest month in a year. February is the coldest with 52.5°F / 11.4°C average temperature.
Activities & POI in Cala en Porter
| Type of Activity | List |
|---|---|
| Attraction | Cova d'en Xoroi |