Nerja Water Temperature
[better-ads type=’banner’ banner=’6711′ ]
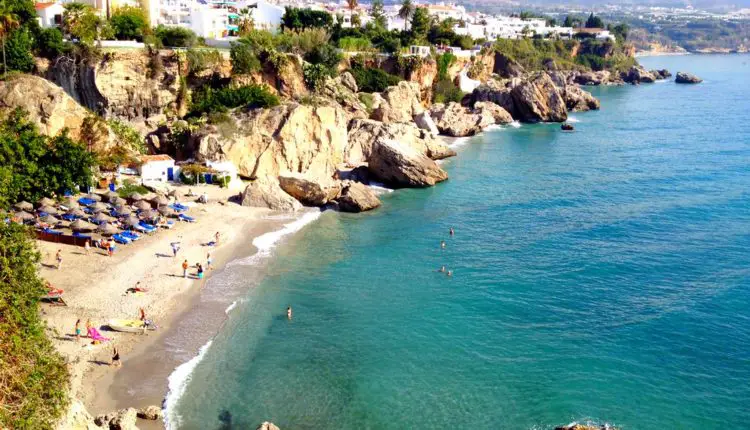
Nerja is a town close to Alboran Sea.
August is the month with the warmest water temperature at 73.2°F / 22.9°C.
The coolest month is February with an avg. water temperature of 57.2°F / 14°C.
March is the sunniest at 0in / 0mm and November the wettest month with 0.6in / 15.1mm.
The average air temperature is around 72.5°F / 22.5°C, August is the hottest month in a year. January is the coolest with 42.6°F / 5.9°C average air temperature.
temperate climate with dry and hot summer would be the climate here.
June, July, August, September would be the best time to visit.
Nerja Summary
| Description | Value |
|---|---|
| Current water temperature | / |
| Warmest Month Water Temperature: | August with 22.9°C / 73.2°F |
| Coldest Month Water Temperature: | February with 14°C / 57.2°F |
| Warmest Month Air Temperature: | August with 22.5°C / 72.5°F |
| Coldest Month Air Temperature: | January with 5.9°C / 42.6°F |
| Wettest Month: | November with 15.1mm / 0.6in |
| Driest Month: | March with 0mm / 0in |
| Highest Humidity | December with 78.5% |
| Lowest Humidity | July with 49.1% |
| Best Time to Visit: | June, July, August, September |
| Climate Classification | temperate climate with dry and hot summer |
[better-ads type=’banner’ banner=’6738′ ]
Nerja water temperature by month
Alboran Sea water temperature by month
| Max. Water
Temperature (°C) |
ø. Water
Temperature (°C) |
Min. Water
Temperature (°C) |
|
|---|---|---|---|
|
January |
14.8 | 14.4 | 14 |
|
February |
14.2 | 14.1 | 13.9 |
|
March |
14.9 | 14.5 | 14.1 |
|
April |
16.1 | 15.2 | 14.7 |
|
May |
18 | 16.9 | 16 |
|
June |
20.8 | 19.2 | 18.2 |
|
July |
22.8 | 21.7 | 20.6 |
|
August |
23.2 | 22.8 | 22.5 |
|
September |
23 | 21.6 | 20.4 |
|
October |
20.5 | 19.4 | 18.2 |
|
November |
18.2 | 16.7 | 15.8 |
|
December |
15.8 | 15.3 | 14.8 |
Alboran Sea water temperature by month
| Max. Water
Temperature (°F) |
ø. Water
Temperature (°F) |
Min. Water
Temperature (°F) |
|
|---|---|---|---|
|
January |
58.6 | 57.9 | 57.2 |
|
February |
57.6 | 57.4 | 57 |
|
March |
58.8 | 58.1 | 57.4 |
|
April |
61 | 59.4 | 58.5 |
|
May |
64.4 | 62.4 | 60.8 |
|
June |
69.4 | 66.6 | 64.8 |
|
July |
73 | 71.1 | 69.1 |
|
August |
73.8 | 73 | 72.5 |
|
September |
73.4 | 70.9 | 68.7 |
|
October |
68.9 | 66.9 | 64.8 |
|
November |
64.8 | 62.1 | 60.4 |
|
December |
60.4 | 59.5 | 58.6 |
The highest water temperature will be reached in August with around 73.2°F / 22.9°C.
The lowest in February with an average water temperature of 57.2°F / 14°C.
[better-ads type=’banner’ banner=’7369′ ]
Nerja weather today & 14-day weather forecast
|
|
|
|
|
|
|
Rel. Humidity |
|---|---|---|---|---|---|---|
|
|
Few clouds
|
|
|
|
|
|
|
|
Clear Sky
|
|
|
|
|
|
|
|
Scattered clouds
|
|
|
|
|
|
|
|
Clear Sky
|
|
|
|
|
|
|
|
Clear Sky
|
|
|
|
|
|
|
|
Clear Sky
|
|
|
|
|
|
|
|
Few clouds
|
|
|
|
|
|
|
|
|
|
|
|
|
Rel. Humidity |
|---|---|---|---|---|---|---|
|
|
Few clouds
|
|
|
|
|
|
|
|
Clear Sky
|
|
|
|
|
|
|
|
Clear Sky
|
|
|
|
|
|
|
|
Few clouds
|
|
|
|
|
|
|
|
Scattered clouds
|
|
|
|
|
|
|
|
Few clouds
|
|
|
|
|
|
|
|
Few clouds
|
|
|
|
|
|
|
|
Few clouds
|
|
|
|
|
|
|
|
Few clouds
|
|
|
|
|
|
Nerja weather by month / climate table
Max. Temperature °C | ø. Temperature °C | Min. Temperature (°C) |
Precip. (mm) |
Rainy Days (d) |
Rel. Humidity (%) |
|
|---|---|---|---|---|---|---|
|
January |
11.5 | 5.9 | 1.3 | 3.2 | 0 | 76.7% |
|
February |
11.6 | 6.2 | 1.4 | 2.4 | 0 | 73.5% |
|
March |
13.8 | 8.3 | 3.1 | 0 | 0 | 70.7% |
|
April |
16.9 | 10.5 | 4.8 | 0 | 0 | 68.3% |
|
May |
20.9 | 14 | 6.6 | 0 | 0 | 63.6% |
|
June |
26.5 | 19 | 12.1 | 0 | 0 | 54.9% |
|
July |
28.3 | 22.5 | 16.2 | 0 | 0 | 49.1% |
|
August |
28.7 | 22.5 | 16.8 | 0 | 0 | 52.3% |
|
September |
25.4 | 18.4 | 12.4 | 0 | 0 | 63.4% |
|
October |
20.9 | 14.4 | 8.7 | 5.1 | 0 | 70.2% |
|
November |
15.7 | 9.1 | 3.2 | 15.1 | 0 | 74% |
|
December |
12.1 | 7 | 2.6 | 13.5 | 0 | 78.5% |
Max. Temperature °F | ø. Temperature °F | Min. Temperature (°F) |
Precip. (in) |
Rainy Days (d) |
Rel. Humidity (%) |
|
|---|---|---|---|---|---|---|
|
January |
52.7 | 42.6 | 34.3 | 0.1 | 0 | 76.7% |
|
February |
52.9 | 43.2 | 34.5 | 0.1 | 0 | 73.5% |
|
March |
56.8 | 46.9 | 37.6 | 0 | 0 | 70.7% |
|
April |
62.4 | 50.9 | 40.6 | 0 | 0 | 68.3% |
|
May |
69.6 | 57.2 | 43.9 | 0 | 0 | 63.6% |
|
June |
79.7 | 66.2 | 53.8 | 0 | 0 | 54.9% |
|
July |
82.9 | 72.5 | 61.2 | 0 | 0 | 49.1% |
|
August |
83.7 | 72.5 | 62.2 | 0 | 0 | 52.3% |
|
September |
77.7 | 65.1 | 54.3 | 0 | 0 | 63.4% |
|
October |
69.6 | 57.9 | 47.7 | 0.2 | 0 | 70.2% |
|
November |
60.3 | 48.4 | 37.8 | 0.6 | 0 | 74% |
|
December |
53.8 | 44.6 | 36.7 | 0.5 | 0 | 78.5% |
March is the month with the lowest rain of 0in / 0mm and November with the highest precipitation in a year with 0.6in / 15.1mm.
The avg. temperature is around 72.5°F / 22.5°C, August is the month with the highest temperature. January is the coolest with 42.6°F / 5.9°C average temperature.
Activities & POI in Nerja
| Type of Activity | List |
|---|---|
| Beach | Playa Calahonda, Playa Carabeillo, Playa La Torrecilla, Playa El Playazo, Playa El Salón, Playa La Caletilla, Playa de Vilches, Playa de Maro, Playa Burriana, Playa de Caleta, Playa de las Alberquillas, Playa El Chucho, Playa Rio Chillar, Playa Carabeo |
| Attraction | Cueva de Nerja, Parking, Jardín Botánico Detunda - Cueva de Nerja |