Fajardo Water Temperature
[better-ads type=’banner’ banner=’6711′ ]
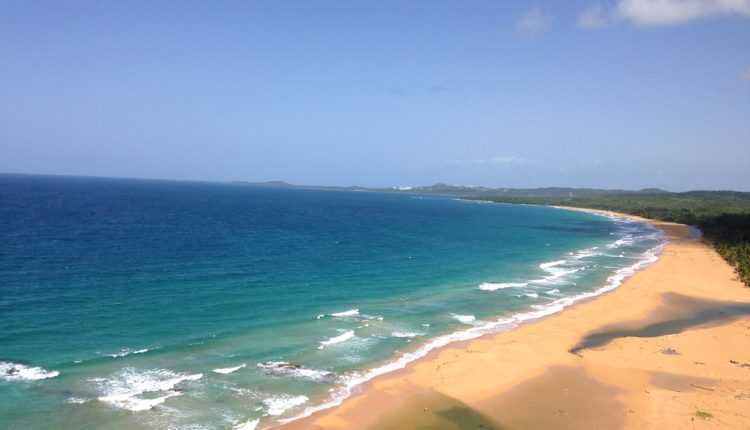
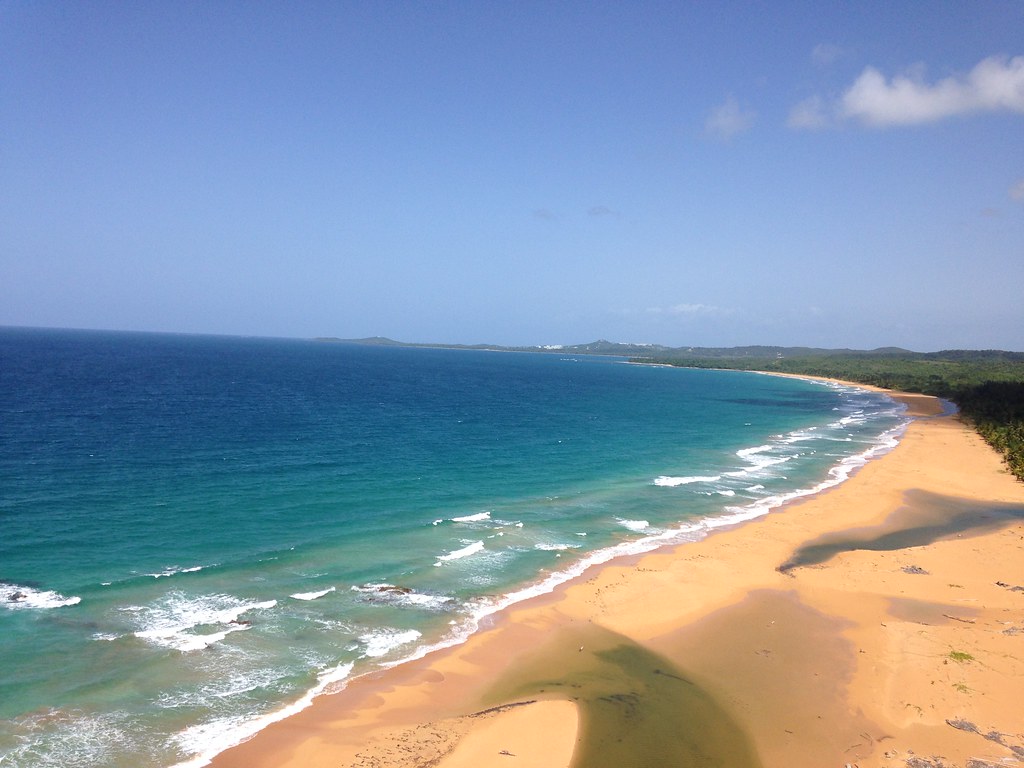
Fajardo is a town close to Caribbean Sea.
September is the month with the highest water temperature at 84.6°F / 29.2°C.
The coldest month is March with an average water temperature of 79°F / 26.1°C.
March is the driest at 2.4in / 61.8mm and August the wettest month with 7.3in / 184.7mm.
With an average air temperature of 79.7°F / 26.5°C, September is the warmest month in a year. February is the coldest with 74.5°F / 23.6°C average air temperature.
The Climate is described as tropical rainforest climate. Best time to Visit would be in January, February, March, April, May, June, July, December.
Fajardo Summary
| Description | Value |
|---|---|
| Current water temperature | / |
| Warmest Month Water Temperature: | September with 84.6°F / 29.2°C |
| Coldest Month Water Temperature: | March with 79°F / 26.1°C |
| Warmest Month Air Temperature: | September with 79.7°F / 26.5°C |
| Coldest Month Air Temperature: | February with 74.5°F / 23.6°C |
| Wettest Month: | August with 7.3in / 184.7mm |
| Driest Month: | March with 2.4in / 61.8mm |
| Highest Humidity | October with 82% |
| Lowest Humidity | March with 73.4% |
| Best Time to Visit: | January, February, March, April, May, June, July, December |
| Climate Classification | tropical rainforest climate |
[better-ads type=’banner’ banner=’6738′ ]
Fajardo water temperature by month
Caribbean Sea water temperature by month
| Max. Water
Temperature (°F) |
ø. Water
Temperature (°F) |
Min. Water
Temperature (°F) |
|
|---|---|---|---|
|
January |
80.4 | 79.9 | 79.3 |
|
February |
79.3 | 79 | 78.8 |
|
March |
79.3 | 79 | 78.8 |
|
April |
80.6 | 79.7 | 79.2 |
|
May |
81.9 | 81 | 80.6 |
|
June |
82.8 | 82.4 | 81.7 |
|
July |
83.5 | 82.9 | 82.4 |
|
August |
84.2 | 83.8 | 83.3 |
|
September |
84.7 | 84.4 | 83.8 |
|
October |
84.6 | 84.4 | 84 |
|
November |
84 | 83.1 | 82.2 |
|
December |
82.2 | 81.3 | 80.6 |
Caribbean Sea water temperature by month
| Max. Water
Temperature (°C) |
ø. Water
Temperature (°C) |
Min. Water
Temperature (°C) |
|
|---|---|---|---|
|
January |
26.9 | 26.6 | 26.3 |
|
February |
26.3 | 26.1 | 26 |
|
March |
26.3 | 26.1 | 26 |
|
April |
27 | 26.5 | 26.2 |
|
May |
27.7 | 27.2 | 27 |
|
June |
28.2 | 28 | 27.6 |
|
July |
28.6 | 28.3 | 28 |
|
August |
29 | 28.8 | 28.5 |
|
September |
29.3 | 29.1 | 28.8 |
|
October |
29.2 | 29.1 | 28.9 |
|
November |
28.9 | 28.4 | 27.9 |
|
December |
27.9 | 27.4 | 27 |
[better-ads type=’banner’ banner=’7369′ ]
Fajardo weather by month / climate table
Max. Temperature °F | ø. Temperature °F | Min. Temperature (°F) |
Precip. (in) |
Rainy Days (d) |
Rel. Humidity (%) |
|
|---|---|---|---|---|---|---|
|
January |
78.6 | 74.7 | 71.4 | 3 | 22 | 77.5% |
|
February |
78.6 | 74.5 | 71.2 | 2.4 | 20 | 75.3% |
|
March |
80.1 | 75 | 71.2 | 2.4 | 15 | 73.4% |
|
April |
81.5 | 76.3 | 72.1 | 3.8 | 22 | 76.2% |
|
May |
82.4 | 77.5 | 73.8 | 5.9 | 25 | 79.5% |
|
June |
83.3 | 79.2 | 75.6 | 4.8 | 26 | 79.4% |
|
July |
83.8 | 79.3 | 75.7 | 6.2 | 28 | 80% |
|
August |
84 | 79.7 | 76.3 | 7.3 | 29 | 81.1% |
|
September |
84.4 | 79.7 | 76.3 | 7 | 27 | 81.3% |
|
October |
83.5 | 79 | 75.7 | 7.2 | 0 | 82% |
|
November |
81.7 | 77.4 | 73 | 6.2 | 25 | 81% |
|
December |
79.5 | 75.7 | 72.9 | 3.9 | 22 | 78.8% |
Max. Temperature °C | ø. Temperature °C | Min. Temperature (°C) |
Precip. (mm) |
Rainy Days (d) |
Rel. Humidity (%) |
|
|---|---|---|---|---|---|---|
|
January |
25.9 | 23.7 | 21.9 | 75.3 | 22 | 77.5% |
|
February |
25.9 | 23.6 | 21.8 | 61.8 | 20 | 75.3% |
|
March |
26.7 | 23.9 | 21.8 | 62.2 | 15 | 73.4% |
|
April |
27.5 | 24.6 | 22.3 | 97.5 | 22 | 76.2% |
|
May |
28 | 25.3 | 23.2 | 148.7 | 25 | 79.5% |
|
June |
28.5 | 26.2 | 24.2 | 122.3 | 26 | 79.4% |
|
July |
28.8 | 26.3 | 24.3 | 156.6 | 28 | 80% |
|
August |
28.9 | 26.5 | 24.6 | 184.7 | 29 | 81.1% |
|
September |
29.1 | 26.5 | 24.6 | 177 | 27 | 81.3% |
|
October |
28.6 | 26.1 | 24.3 | 183.2 | 0 | 82% |
|
November |
27.6 | 25.2 | 22.8 | 158.3 | 25 | 81% |
|
December |
26.4 | 24.3 | 22.7 | 100.3 | 22 | 78.8% |
March is the most draught at 2.4in / 61.8mm and August the month with the most rain around 7.3in / 184.7mm.
The avg. temperature is around 79.7°F / 26.5°C, September is the hottest month in a year. February is the coolest with 74.5°F / 23.6°C avg. temperature.
Activities & POI in Fajardo
| Type of Activity | List |
|---|---|
| Beach | Playa Icacos, Palomino, Playa Colorá, Balneario Seven Seas, Playa Escondida, Playa el Convento, Playa Canalejo |
| Attraction | Faro de Las Cabezas de San Juan |
| Golf Course | Arthur Hills Golf Course |