Fernandina Beach Water Temperature
[better-ads type=’banner’ banner=’6711′ ]
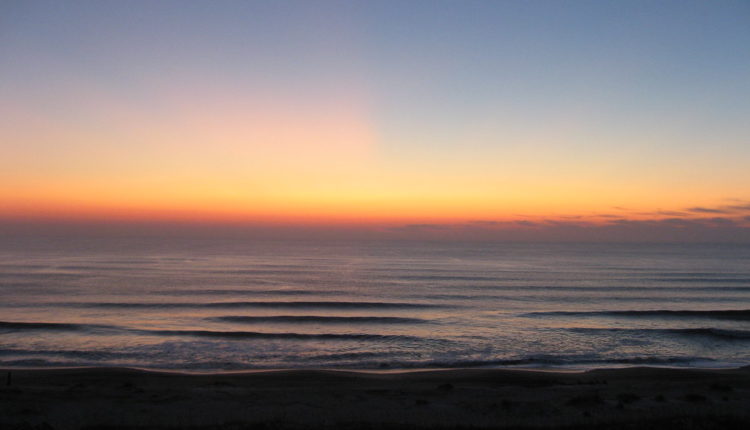
Fernandina Beach is a town close to Atlantic Ocean.
August is the month with the highest water temperature at 83.5°F / 28.6°C.
The coldest month is February with an average water temperature of 57.2°F / 14°C.
January is the driest at 0in / 0mm and August the wettest month with 4.4in / 111mm.
With an average air temperature of 81°F / 27.2°C, July is the warmest month in a year. January is the coldest with 54.1°F / 12.3°C average air temperature.
The Climate is described as mild temperate climate with hot summer. Best time to Visit would be in May, June, July, August, September.
Fernandina Beach Summary
| Description | Value |
|---|---|
| Current water temperature | / |
| Warmest Month Water Temperature: | August with 83.5°F / 28.6°C |
| Coldest Month Water Temperature: | February with 57.2°F / 14°C |
| Warmest Month Air Temperature: | July with 81°F / 27.2°C |
| Coldest Month Air Temperature: | January with 54.1°F / 12.3°C |
| Wettest Month: | August with 4.4in / 111mm |
| Driest Month: | January with 0in / 0mm |
| Highest Humidity | August with 81.7% |
| Lowest Humidity | April with 68.8% |
| Best Time to Visit: | May, June, July, August, September |
| Climate Classification | mild temperate climate with hot summer |
[better-ads type=’banner’ banner=’6738′ ]
Fernandina Beach water temperature by month
Atlantic Ocean water temperature by month
| Max. Water
Temperature (°F) |
ø. Water
Temperature (°F) |
Min. Water
Temperature (°F) |
|
|---|---|---|---|
|
January |
60.8 | 58.8 | 57 |
|
February |
58.3 | 57.4 | 56.7 |
|
March |
63 | 60.1 | 57.9 |
|
April |
70.2 | 66.4 | 63 |
|
May |
77.7 | 73.9 | 70.5 |
|
June |
82 | 80.2 | 77.7 |
|
July |
83.5 | 82.8 | 81.7 |
|
August |
83.7 | 83.3 | 82.8 |
|
September |
83.5 | 81.9 | 80.1 |
|
October |
80.1 | 76.6 | 72.7 |
|
November |
72.7 | 68.7 | 64.8 |
|
December |
64.8 | 62.2 | 60.3 |
Atlantic Ocean water temperature by month
| Max. Water
Temperature (°C) |
ø. Water
Temperature (°C) |
Min. Water
Temperature (°C) |
|
|---|---|---|---|
|
January |
16 | 14.9 | 13.9 |
|
February |
14.6 | 14.1 | 13.7 |
|
March |
17.2 | 15.6 | 14.4 |
|
April |
21.2 | 19.1 | 17.2 |
|
May |
25.4 | 23.3 | 21.4 |
|
June |
27.8 | 26.8 | 25.4 |
|
July |
28.6 | 28.2 | 27.6 |
|
August |
28.7 | 28.5 | 28.2 |
|
September |
28.6 | 27.7 | 26.7 |
|
October |
26.7 | 24.8 | 22.6 |
|
November |
22.6 | 20.4 | 18.2 |
|
December |
18.2 | 16.8 | 15.7 |
[better-ads type=’banner’ banner=’7369′ ]
Fernandina Beach weather today & 14-day weather forecast
|
|
|
|
|
|
|
Rel. Humidity |
|---|---|---|---|---|---|---|
|
|
Thunderstorm with rain
|
|
|
|
|
|
|
|
Broken clouds
|
|
|
|
|
|
|
|
Thunderstorm with rain
|
|
|
|
|
|
|
|
Thunderstorm with rain
|
|
|
|
|
|
|
|
Broken clouds
|
|
|
|
|
|
|
|
Scattered clouds
|
|
|
|
|
|
|
|
Heavy rain
|
|
|
|
|
|
|
|
|
|
|
|
|
Rel. Humidity |
|---|---|---|---|---|---|---|
|
|
Thunderstorm with rain
|
|
|
|
|
|
|
|
Moderate rain
|
|
|
|
|
|
|
|
Thunderstorm with rain
|
|
|
|
|
|
|
|
Overcast clouds
|
|
|
|
|
|
|
|
Thunderstorm with rain
|
|
|
|
|
|
|
|
Thunderstorm with heavy rain
|
|
|
|
|
|
|
|
Scattered clouds
|
|
|
|
|
|
|
|
Thunderstorm with rain
|
|
|
|
|
|
|
|
Scattered clouds
|
|
|
|
|
|
Fernandina Beach weather by month / climate table
Max. Temperature °F | ø. Temperature °F | Min. Temperature (°F) |
Precip. (in) |
Rainy Days (d) |
Rel. Humidity (%) |
|
|---|---|---|---|---|---|---|
|
January |
64.2 | 54.1 | 44.8 | 0 | 0 | 72.2% |
|
February |
70.9 | 57 | 46.6 | 0 | 0 | 73.2% |
|
March |
73.6 | 61.7 | 49.5 | 0 | 0 | 69.3% |
|
April |
78.8 | 68.2 | 58.6 | 0 | 0 | 68.8% |
|
May |
84.6 | 74.5 | 64.9 | 0.1 | 0 | 69.8% |
|
June |
87.3 | 79.3 | 72.5 | 2.9 | 7 | 77.3% |
|
July |
88.5 | 81 | 75 | 2.6 | 8 | 79.5% |
|
August |
88.5 | 80.8 | 75.7 | 4.4 | 17 | 81.7% |
|
September |
85.1 | 78.1 | 72.3 | 3.2 | 11 | 80.1% |
|
October |
80.1 | 71.8 | 62.6 | 0.3 | 0 | 74.6% |
|
November |
75.4 | 63.5 | 52.9 | 0 | 0 | 72.9% |
|
December |
68 | 58.3 | 49.5 | 0 | 0 | 75.1% |
Max. Temperature °C | ø. Temperature °C | Min. Temperature (°C) |
Precip. (mm) |
Rainy Days (d) |
Rel. Humidity (%) |
|
|---|---|---|---|---|---|---|
|
January |
17.9 | 12.3 | 7.1 | 0 | 0 | 72.2% |
|
February |
21.6 | 13.9 | 8.1 | 0 | 0 | 73.2% |
|
March |
23.1 | 16.5 | 9.7 | 0 | 0 | 69.3% |
|
April |
26 | 20.1 | 14.8 | 0 | 0 | 68.8% |
|
May |
29.2 | 23.6 | 18.3 | 2.1 | 0 | 69.8% |
|
June |
30.7 | 26.3 | 22.5 | 73.9 | 7 | 77.3% |
|
July |
31.4 | 27.2 | 23.9 | 65.4 | 8 | 79.5% |
|
August |
31.4 | 27.1 | 24.3 | 111 | 17 | 81.7% |
|
September |
29.5 | 25.6 | 22.4 | 81.1 | 11 | 80.1% |
|
October |
26.7 | 22.1 | 17 | 7.9 | 0 | 74.6% |
|
November |
24.1 | 17.5 | 11.6 | 0 | 0 | 72.9% |
|
December |
20 | 14.6 | 9.7 | 0 | 0 | 75.1% |
The warmest avg. temperature is around 81°F / 27.2°C, July is the month with the highest temperature. January is the coolest with 54.1°F / 12.3°C average air temperature.
January is the month with the min. precipitation of 0in / 0mm and August with the max. precipitation in a year with 4.4in / 111mm.
Activities & POI in Fernandina Beach
| Type of Activity | List |
|---|---|
| Beach | Blackrock Beach, Bone Yard Beach |
| Golf Course | Fernandina Beach Municipal Golf Course, Amelia River Golf Course, The Golf Club of Amelia Island |