Catalina Island Water Temperature
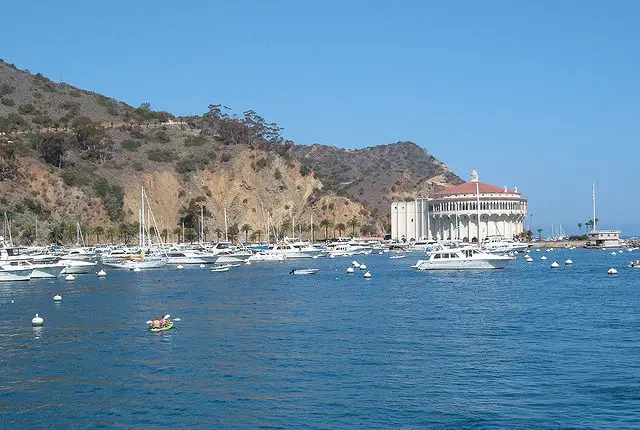
Catalina Island is situated off the coast of California and is considered one of the best holiday destinations for those who want to have fun and adventure. The region is popular because of the multiple activities that take place all year round. It is also true that this region is one of the safest because of the well laid down security measures. Here are just a couple of things you should know when thinking of vacationing in Catalina.
[better-ads type=’banner’ banner=’6711′ ]
As was mentioned before, you can visit this destination all year round, however, there are slight variations in the Catalina Island water temperature in different seasons and that is why you should be keen on the issue especially if you are planning on engaging in water activities. Some of the most popular activities to enjoy in the region include; partying, leisure walks, sight seeing, scuba diving, swimming, sunbathing, picnics and boat rides. Travel options available for you include; roads, railways and air travel.
Catalina Island Summary
| Description | Value |
|---|---|
| Current water temperature | / |
| Warmest Month Water Temperature: | August with 68.2°F / 20.1°C |
| Coldest Month Water Temperature: | March with 57.9°F / 14.4°C |
| Warmest Month Air Temperature: | August with 66°F / 18.9°C |
| Coldest Month Air Temperature: | February with 55.6°F / 13.1°C |
| Wettest Month: | January with 0in / 0mm |
| Driest Month: | January with 0in / 0mm |
| Highest Humidity | August with 82.3% |
| Lowest Humidity | December with 74% |
| Best Time to Visit: | June, July, August, September |
| Climate Classification | cold steppe climates |
Catalina Island water temperature by month
pacific ocean water temperature by month
| Max. Water
Temperature (°F) |
ø. Water
Temperature (°F) |
Min. Water
Temperature (°F) |
|
|---|---|---|---|
|
January |
58.6 | 58.5 | 58.1 |
|
February |
58.3 | 58.1 | 57.6 |
|
March |
58.3 | 57.9 | 57.7 |
|
April |
59.9 | 58.6 | 57.9 |
|
May |
62.6 | 61.2 | 59.9 |
|
June |
65.5 | 64 | 62.6 |
|
July |
68.2 | 67.1 | 65.5 |
|
August |
68.7 | 68 | 67.5 |
|
September |
68.9 | 67.8 | 67.1 |
|
October |
67.1 | 65.8 | 64.8 |
|
November |
64.8 | 63.1 | 61 |
|
December |
61.2 | 59.9 | 58.6 |
pacific ocean water temperature by month
| Max. Water
Temperature (°C) |
ø. Water
Temperature (°C) |
Min. Water
Temperature (°C) |
|
|---|---|---|---|
|
January |
14.8 | 14.7 | 14.5 |
|
February |
14.6 | 14.5 | 14.2 |
|
March |
14.6 | 14.4 | 14.3 |
|
April |
15.5 | 14.8 | 14.4 |
|
May |
17 | 16.2 | 15.5 |
|
June |
18.6 | 17.8 | 17 |
|
July |
20.1 | 19.5 | 18.6 |
|
August |
20.4 | 20 | 19.7 |
|
September |
20.5 | 19.9 | 19.5 |
|
October |
19.5 | 18.8 | 18.2 |
|
November |
18.2 | 17.3 | 16.1 |
|
December |
16.2 | 15.5 | 14.8 |
[better-ads type=’banner’ banner=’6738′ ]
[better-ads type=’banner’ banner=’7369′ ]
Catalina Island weather today & 14-day weather forecast
|
|
|
|
|
|
|
Rel. Humidity |
|---|---|---|---|---|---|---|
|
|
Thunderstorm with heavy rain
|
|
|
|
|
|
|
|
Broken clouds
|
|
|
|
|
|
|
|
Scattered clouds
|
|
|
|
|
|
|
|
Thunderstorm with rain
|
|
|
|
|
|
|
|
Broken clouds
|
|
|
|
|
|
|
|
Thunderstorm with rain
|
|
|
|
|
|
|
|
Light rain
|
|
|
|
|
|
|
|
|
|
|
|
|
Rel. Humidity |
|---|---|---|---|---|---|---|
|
|
Broken clouds
|
|
|
|
|
|
|
|
Broken clouds
|
|
|
|
|
|
|
|
Thunderstorm with rain
|
|
|
|
|
|
|
|
Heavy rain
|
|
|
|
|
|
|
|
Broken clouds
|
|
|
|
|
|
|
|
Thunderstorm with rain
|
|
|
|
|
|
|
|
Heavy rain
|
|
|
|
|
|
|
|
Scattered clouds
|
|
|
|
|
|
|
|
Few clouds
|
|
|
|
|
|
Catalina Island weather by month / climate table
Max. Temperature °F | ø. Temperature °F | Min. Temperature (°F) |
Precip. (in) |
Rainy Days (d) |
Rel. Humidity (%) |
|
|---|---|---|---|---|---|---|
|
January |
60.8 | 55.9 | 50.7 | 0 | 0 | 75.7% |
|
February |
59.7 | 55.6 | 50.9 | 0 | 0 | 76.6% |
|
March |
60.1 | 56.3 | 52 | 0 | 0 | 78.7% |
|
April |
62.1 | 57.2 | 53.4 | 0 | 0 | 77.7% |
|
May |
63 | 59.4 | 55.8 | 0 | 0 | 78.9% |
|
June |
66 | 61.9 | 57.2 | 0 | 0 | 81% |
|
July |
68.9 | 65.1 | 61.3 | 0 | 0 | 82.1% |
|
August |
69.6 | 66 | 63.1 | 0 | 0 | 82.3% |
|
September |
69.8 | 66 | 62.4 | 0 | 0 | 81.7% |
|
October |
68.9 | 64 | 59 | 0 | 0 | 78.8% |
|
November |
65.5 | 60.4 | 54.5 | 0 | 0 | 75.1% |
|
December |
61 | 56.5 | 50.9 | 0 | 0 | 74% |
Max. Temperature °C | ø. Temperature °C | Min. Temperature (°C) |
Precip. (mm) |
Rainy Days (d) |
Rel. Humidity (%) |
|
|---|---|---|---|---|---|---|
|
January |
16 | 13.3 | 10.4 | 0 | 0 | 75.7% |
|
February |
15.4 | 13.1 | 10.5 | 0 | 0 | 76.6% |
|
March |
15.6 | 13.5 | 11.1 | 0 | 0 | 78.7% |
|
April |
16.7 | 14 | 11.9 | 0 | 0 | 77.7% |
|
May |
17.2 | 15.2 | 13.2 | 0 | 0 | 78.9% |
|
June |
18.9 | 16.6 | 14 | 0 | 0 | 81% |
|
July |
20.5 | 18.4 | 16.3 | 0 | 0 | 82.1% |
|
August |
20.9 | 18.9 | 17.3 | 0 | 0 | 82.3% |
|
September |
21 | 18.9 | 16.9 | 0 | 0 | 81.7% |
|
October |
20.5 | 17.8 | 15 | 0 | 0 | 78.8% |
|
November |
18.6 | 15.8 | 12.5 | 0 | 0 | 75.1% |
|
December |
16.1 | 13.6 | 10.5 | 0 | 0 | 74% |
Activities & POI in Catalina Island
| Type of Activity | List |
|---|---|
| Beach | Sullivans Beach, Wells Beach, Empire Landing, Rippers Cove, Paradise Cove, Cottonwood Beach, Ben Weston Beach, Gibralter Beach, Cabrillo Beach, Old Ben Weston Beach |
| Attraction | Spouting Caves, Salta Verde Point, Perdition Caves, Lion Head, Whales Tail |
Picture Copyright: Flickr CC 2.0 mrkathika