Carpinteria Water Temperature
[better-ads type=’banner’ banner=’6711′ ]
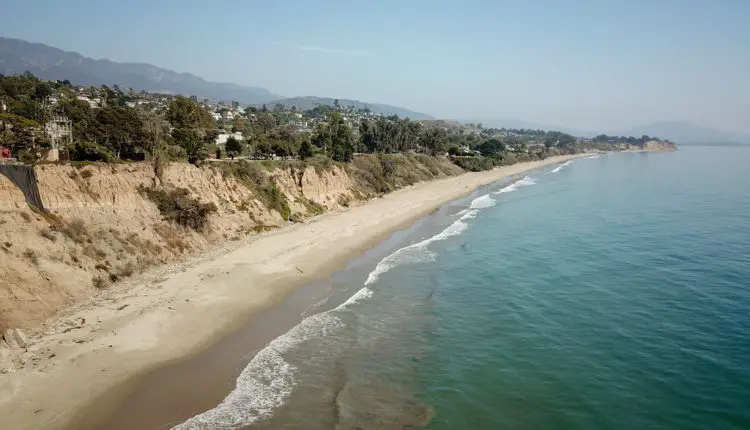
Carpinteria is a town close to Pacific Ocean.
September is the month with the highest water temperature at 63.9°F / 17.7°C.
The coldest month is April with an average water temperature of 54.9°F / 12.7°C.
January is the driest at 0in / 0mm and January the wettest month with 0in / 0mm.
With an average air temperature of 72.7°F / 22.6°C, August is the warmest month in a year. December is the coldest with 52.2°F / 11.2°C average air temperature.
The Climate is described as temperate climate with warm and dry summer. Best time to Visit would be in June, July, August, September.
Carpinteria Summary
| Description | Value |
|---|---|
| Current water temperature | / |
| Warmest Month Water Temperature: | September with 63.9°F / 17.7°C |
| Coldest Month Water Temperature: | April with 54.9°F / 12.7°C |
| Warmest Month Air Temperature: | August with 72.7°F / 22.6°C |
| Coldest Month Air Temperature: | December with 52.2°F / 11.2°C |
| Wettest Month: | January with 0in / 0mm |
| Driest Month: | January with 0in / 0mm |
| Highest Humidity | July with 62.6% |
| Lowest Humidity | November with 55.5% |
| Best Time to Visit: | June, July, August, September |
| Climate Classification | temperate climate with warm and dry summer |
[better-ads type=’banner’ banner=’6738′ ]
Carpinteria water temperature by month
Pacific Ocean water temperature by month
| Max. Water
Temperature (°F) |
ø. Water
Temperature (°F) |
Min. Water
Temperature (°F) |
|
|---|---|---|---|
|
January |
57 | 56.8 | 56.5 |
|
February |
56.5 | 56.3 | 55.8 |
|
March |
56.1 | 55.6 | 55 |
|
April |
55.6 | 55 | 54.5 |
|
May |
57.4 | 56.3 | 55.4 |
|
June |
61 | 59.2 | 57.2 |
|
July |
64 | 62.6 | 61 |
|
August |
63.9 | 63.1 | 62.6 |
|
September |
64.2 | 63.7 | 63.1 |
|
October |
63.3 | 62.6 | 62.1 |
|
November |
62.2 | 60.6 | 58.8 |
|
December |
58.8 | 57.9 | 56.8 |
Pacific Ocean water temperature by month
| Max. Water
Temperature (°C) |
ø. Water
Temperature (°C) |
Min. Water
Temperature (°C) |
|
|---|---|---|---|
|
January |
13.9 | 13.8 | 13.6 |
|
February |
13.6 | 13.5 | 13.2 |
|
March |
13.4 | 13.1 | 12.8 |
|
April |
13.1 | 12.8 | 12.5 |
|
May |
14.1 | 13.5 | 13 |
|
June |
16.1 | 15.1 | 14 |
|
July |
17.8 | 17 | 16.1 |
|
August |
17.7 | 17.3 | 17 |
|
September |
17.9 | 17.6 | 17.3 |
|
October |
17.4 | 17 | 16.7 |
|
November |
16.8 | 15.9 | 14.9 |
|
December |
14.9 | 14.4 | 13.8 |
[better-ads type=’banner’ banner=’7369′ ]
Carpinteria weather today & 14-day weather forecast
|
|
|
|
|
|
|
Rel. Humidity |
|---|---|---|---|---|---|---|
|
|
Broken clouds
|
|
|
|
|
|
|
|
Broken clouds
|
|
|
|
|
|
|
|
Broken clouds
|
|
|
|
|
|
|
|
Broken clouds
|
|
|
|
|
|
|
|
Broken clouds
|
|
|
|
|
|
|
|
Scattered clouds
|
|
|
|
|
|
|
|
Few clouds
|
|
|
|
|
|
|
|
|
|
|
|
|
Rel. Humidity |
|---|---|---|---|---|---|---|
|
|
Few clouds
|
|
|
|
|
|
|
|
Few clouds
|
|
|
|
|
|
|
|
Few clouds
|
|
|
|
|
|
|
|
Clear Sky
|
|
|
|
|
|
|
|
Clear Sky
|
|
|
|
|
|
|
|
Few clouds
|
|
|
|
|
|
|
|
Clear Sky
|
|
|
|
|
|
|
|
Few clouds
|
|
|
|
|
|
|
|
Scattered clouds
|
|
|
|
|
|
Carpinteria weather by month / climate table
Max. Temperature °F | ø. Temperature °F | Min. Temperature (°F) |
Precip. (in) |
Rainy Days (d) |
Rel. Humidity (%) |
|
|---|---|---|---|---|---|---|
|
January |
65.8 | 52.9 | 42.6 | 0 | 0 | 59.9% |
|
February |
65.8 | 52.7 | 43 | 0 | 0 | 61% |
|
March |
69.6 | 55.6 | 44.1 | 0 | 0 | 60.7% |
|
April |
73 | 58.5 | 46.6 | 0 | 0 | 56.2% |
|
May |
75.2 | 63.1 | 50.9 | 0 | 0 | 57.1% |
|
June |
80.6 | 67.8 | 55.4 | 0 | 0 | 60% |
|
July |
84.2 | 72.3 | 62.4 | 0 | 0 | 62.6% |
|
August |
84.4 | 72.7 | 62.8 | 0 | 0 | 61% |
|
September |
82.8 | 70.7 | 59.7 | 0 | 0 | 58.4% |
|
October |
79.9 | 64.8 | 52 | 0 | 0 | 55.7% |
|
November |
72.3 | 58.1 | 46.2 | 0 | 0 | 55.5% |
|
December |
64.6 | 52.2 | 42.6 | 0 | 0 | 61% |
Max. Temperature °C | ø. Temperature °C | Min. Temperature (°C) |
Precip. (mm) |
Rainy Days (d) |
Rel. Humidity (%) |
|
|---|---|---|---|---|---|---|
|
January |
18.8 | 11.6 | 5.9 | 0 | 0 | 59.9% |
|
February |
18.8 | 11.5 | 6.1 | 0 | 0 | 61% |
|
March |
20.9 | 13.1 | 6.7 | 0 | 0 | 60.7% |
|
April |
22.8 | 14.7 | 8.1 | 0 | 0 | 56.2% |
|
May |
24 | 17.3 | 10.5 | 0 | 0 | 57.1% |
|
June |
27 | 19.9 | 13 | 0 | 0 | 60% |
|
July |
29 | 22.4 | 16.9 | 0 | 0 | 62.6% |
|
August |
29.1 | 22.6 | 17.1 | 0 | 0 | 61% |
|
September |
28.2 | 21.5 | 15.4 | 0 | 0 | 58.4% |
|
October |
26.6 | 18.2 | 11.1 | 0 | 0 | 55.7% |
|
November |
22.4 | 14.5 | 7.9 | 0 | 0 | 55.5% |
|
December |
18.1 | 11.2 | 5.9 | 0 | 0 | 61% |
January is the month with the lowest rain of 0in / 0mm and January with the highest precipitation in a year with 0in / 0mm.
The avg. temperature is around 72.7°F / 22.6°C, August is the month with the highest temperature. December is the coolest with 52.2°F / 11.2°C average temperature.
Activities & POI in Carpinteria
| Type of Activity | List |
|---|---|
| Beach | La Conchita Beach, Oil Piers Beach, Carpinteria City Beach, Rincon beach, Carpinteria Seal Sanctuary |
| Attraction | Santa Barbara Polo & Racquet Club |
| Caravan Site | Carpinteria Camper Park |