Tura Beach Water Temperature
[better-ads type=’banner’ banner=’6711′ ]
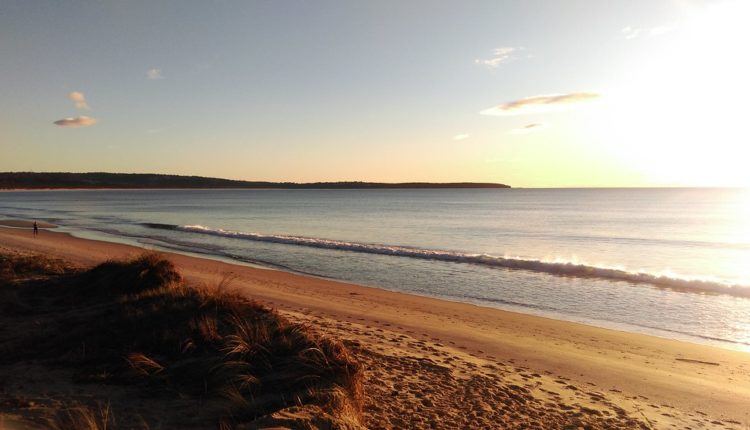
Tura Beach is a village close to Tasman Sea.
February is the month with the highest water temperature at 73°F / 22.8°C.
The coldest month is August with an average water temperature of 62.2°F / 16.8°C.
August is the driest at 0in / 0.6mm and February the wettest month with 3.2in / 81.3mm.
With an average air temperature of 67.8°F / 19.9°C, January is the warmest month in a year. July is the coldest with 51.3°F / 10.7°C average air temperature.
The Climate is described as temperate oceanic climate with warm summer. Best time to Visit would be in January, February, March, December.
Tura Beach Summary
| Description | Value |
|---|---|
| Current water temperature | / |
| Warmest Month Water Temperature: | February with 22.8°C / 73°F |
| Coldest Month Water Temperature: | August with 16.8°C / 62.2°F |
| Warmest Month Air Temperature: | January with 19.9°C / 67.8°F |
| Coldest Month Air Temperature: | July with 10.7°C / 51.3°F |
| Wettest Month: | February with 81.3mm / 3.2in |
| Driest Month: | August with 0.6mm / 0in |
| Highest Humidity | February with 75.6% |
| Lowest Humidity | August with 68.9% |
| Best Time to Visit: | January, February, March, December |
| Climate Classification | temperate oceanic climate with warm summer |
[better-ads type=’banner’ banner=’6738′ ]
Tura Beach water temperature by month
Tasman Sea water temperature by month
| Max. Water
Temperature (°C) |
ø. Water
Temperature (°C) |
Min. Water
Temperature (°C) |
|
|---|---|---|---|
|
January |
22.5 | 22 | 21.5 |
|
February |
22.9 | 22.7 | 22.3 |
|
March |
22.8 | 22.5 | 22.2 |
|
April |
22.3 | 21.6 | 20.8 |
|
May |
20.9 | 20 | 19 |
|
June |
19.2 | 18.5 | 17.7 |
|
July |
17.8 | 17.1 | 16.7 |
|
August |
17.1 | 16.9 | 16.7 |
|
September |
17.4 | 17.2 | 16.7 |
|
October |
18.5 | 17.9 | 17.2 |
|
November |
20 | 19.1 | 18.4 |
|
December |
21.4 | 20.7 | 19.9 |
Tasman Sea water temperature by month
| Max. Water
Temperature (°F) |
ø. Water
Temperature (°F) |
Min. Water
Temperature (°F) |
|
|---|---|---|---|
|
January |
72.5 | 71.6 | 70.7 |
|
February |
73.2 | 72.9 | 72.1 |
|
March |
73 | 72.5 | 72 |
|
April |
72.1 | 70.9 | 69.4 |
|
May |
69.6 | 68 | 66.2 |
|
June |
66.6 | 65.3 | 63.9 |
|
July |
64 | 62.8 | 62.1 |
|
August |
62.8 | 62.4 | 62.1 |
|
September |
63.3 | 63 | 62.1 |
|
October |
65.3 | 64.2 | 63 |
|
November |
68 | 66.4 | 65.1 |
|
December |
70.5 | 69.3 | 67.8 |
February is the month with the warmest water temperature at 73°F / 22.8°C.
The month with the coldest is August with an average water temperature of 62.2°F / 16.8°C.
[better-ads type=’banner’ banner=’7369′ ]
Tura Beach weather today & 14-day weather forecast
|
|
|
|
|
|
|
Rel. Humidity |
|---|---|---|---|---|---|---|
|
|
Clear Sky
|
|
|
|
|
|
|
|
Few clouds
|
|
|
|
|
|
|
|
Broken clouds
|
|
|
|
|
|
|
|
Few clouds
|
|
|
|
|
|
|
|
Broken clouds
|
|
|
|
|
|
|
|
Few clouds
|
|
|
|
|
|
|
|
Scattered clouds
|
|
|
|
|
|
|
|
|
|
|
|
|
Rel. Humidity |
|---|---|---|---|---|---|---|
|
|
Overcast clouds
|
|
|
|
|
|
|
|
Heavy rain
|
|
|
|
|
|
|
|
Few clouds
|
|
|
|
|
|
|
|
Broken clouds
|
|
|
|
|
|
|
|
Few clouds
|
|
|
|
|
|
|
|
Broken clouds
|
|
|
|
|
|
|
|
Few clouds
|
|
|
|
|
|
|
|
Few clouds
|
|
|
|
|
|
|
|
Few clouds
|
|
|
|
|
|
Tura Beach weather by month / climate table
Max. Temperature °C | ø. Temperature °C | Min. Temperature (°C) |
Precip. (mm) |
Rainy Days (d) |
Rel. Humidity (%) |
|
|---|---|---|---|---|---|---|
|
January |
25.3 | 19.9 | 15.6 | 50.9 | 1 | 73.1% |
|
February |
24.4 | 19.7 | 16.3 | 81.3 | 1 | 75.6% |
|
March |
23.3 | 18.4 | 14.2 | 58.4 | 1 | 74.6% |
|
April |
21 | 16.1 | 12 | 41.6 | 0 | 74.9% |
|
May |
18.8 | 13.5 | 9.9 | 6 | 0 | 73% |
|
June |
15.2 | 11.4 | 7.9 | 4.5 | 0 | 75% |
|
July |
15 | 10.7 | 7.4 | 1.4 | 0 | 72.1% |
|
August |
16.1 | 11.2 | 7.5 | 0.6 | 0 | 68.9% |
|
September |
18.9 | 13 | 8.7 | 23.6 | 0 | 69.1% |
|
October |
20.4 | 14.5 | 10.1 | 18.8 | 0 | 69.6% |
|
November |
22.9 | 16.4 | 12.1 | 69.9 | 2 | 72.1% |
|
December |
23.8 | 18 | 13.6 | 50.6 | 1 | 71.9% |
Max. Temperature °F | ø. Temperature °F | Min. Temperature (°F) |
Precip. (in) |
Rainy Days (d) |
Rel. Humidity (%) |
|
|---|---|---|---|---|---|---|
|
January |
77.5 | 67.8 | 60.1 | 2 | 1 | 73.1% |
|
February |
75.9 | 67.5 | 61.3 | 3.2 | 1 | 75.6% |
|
March |
73.9 | 65.1 | 57.6 | 2.3 | 1 | 74.6% |
|
April |
69.8 | 61 | 53.6 | 1.6 | 0 | 74.9% |
|
May |
65.8 | 56.3 | 49.8 | 0.2 | 0 | 73% |
|
June |
59.4 | 52.5 | 46.2 | 0.2 | 0 | 75% |
|
July |
59 | 51.3 | 45.3 | 0.1 | 0 | 72.1% |
|
August |
61 | 52.2 | 45.5 | 0 | 0 | 68.9% |
|
September |
66 | 55.4 | 47.7 | 0.9 | 0 | 69.1% |
|
October |
68.7 | 58.1 | 50.2 | 0.7 | 0 | 69.6% |
|
November |
73.2 | 61.5 | 53.8 | 2.8 | 2 | 72.1% |
|
December |
74.8 | 64.4 | 56.5 | 2 | 1 | 71.9% |
August is the month with the lowest rain of 0in / 0.6mm and February with the highest precipitation in a year with 3.2in / 81.3mm.
The avg. temperature is around 67.8°F / 19.9°C, January is the month with the highest temperature. July is the coolest with 51.3°F / 10.7°C average temperature.
Activities & POI in Tura Beach
| Type of Activity | List |
|---|---|
| Beach | Bournda Beach, Tura Beach |
| Attraction | Snorkelling |
| Golf Course | Tura Beach Country Club |